

Executive Summary
The United States playground market — spanning indoor commercial play centers and outdoor public/park equipment — is entering a mature but resilient growth phase. Post-pandemic recovery, the return of family-oriented spending, and rising demand for safe, screen-free physical activity have combined to lift the sector back above 2019 baselines. This report summarizes market size, structural drivers, competitive dynamics, and near-term outlook for both segments.
Market Size & Growth
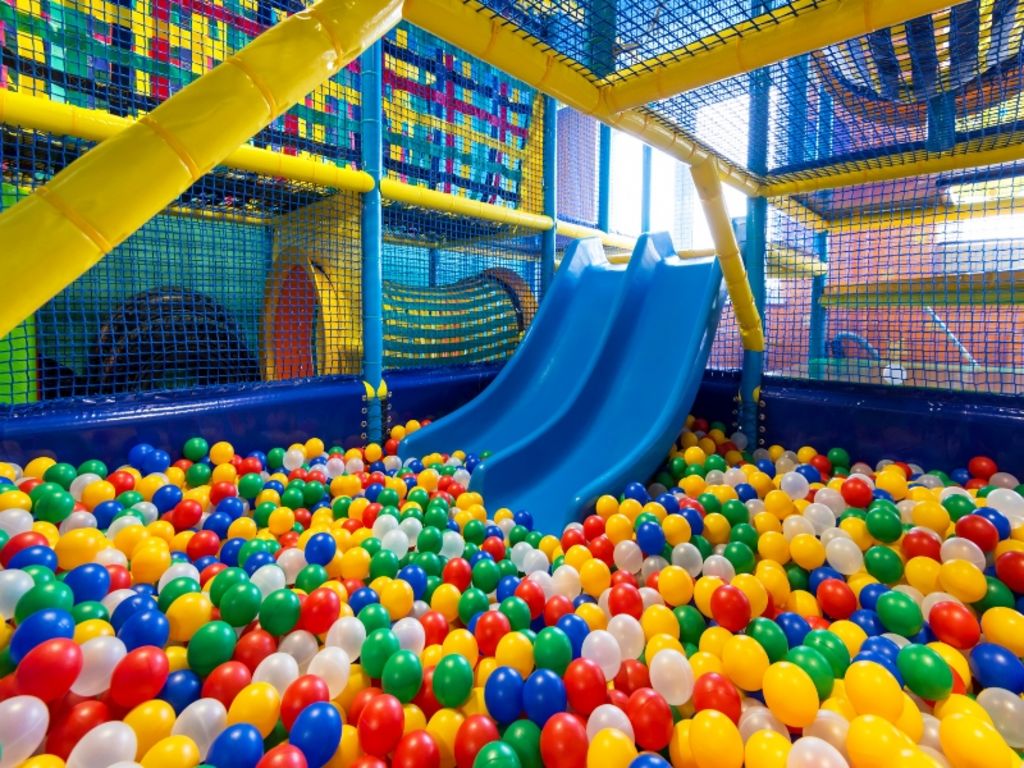
The U.S. indoor playground / family entertainment center (FEC) segment was valued at roughly USD 5.8–6.5 billion in 2024, with a projected CAGR of 7–9% through 2030. Growth is concentrated in soft-play franchises (Urban Air, Sky Zone, Altitude, Launch), toddler-focused boutique studios, and hybrid concepts that bundle trampolines, ninja courses, arcade redemption, and paid party packages.
The outdoor playground equipment segment — driven by municipal parks, K-12 schools, HOAs, and childcare facilities — was estimated at USD 2.1–2.6 billion in 2024, growing at a steadier 4–6% CAGR. Public infrastructure spending, ADA-compliance retrofits, and inclusive-play mandates are the largest tailwinds.

Demand Drivers
- Birthday-economy resilience: Parents continue to prioritize kids’ experiences even during discretionary-spend pullbacks; average party ticket at branded FECs sits between USD 350–600.
- Weather-proofing: Indoor centers thrive in the Sun Belt (extreme summer heat) and Snow Belt (long winters). Roughly 68% of new indoor openings 2022–2024 were in these two climate bands.
- Health & anti-sedentary policy: CDC and pediatric guidance recommending 60+ minutes of daily active play supports both segments.
- Inclusive & sensory-friendly design: Sensory hours, wheelchair-accessible surfacing, and neurodivergent-friendly zoning are now table stakes for public bids and a differentiator for indoor operators.
- ESG-driven material shift: Recycled HDPE, powder-coated steel, and shade-integrated structures dominate new outdoor specs.
Competitive Landscape
Indoor: The market is fragmented but consolidating. Top franchise networks — Urban Air Adventure Park (~230 U.S. locations), Sky Zone (~160), Altitude, Launch, and Rockin’ Jump — collectively hold an estimated 35–40% share, with the remainder split across regional chains and thousands of independent operators. Private equity (Unleashed Brands, Circana-backed rollups) continues to acquire single-unit operators.
Outdoor: Concentrated at the manufacturer level. PlayCore (Miracle, GameTime), Landscape Structures, KOMPAN, Playworld, and BCI Burke together control the majority of institutional installations. Procurement flows through GSA schedules, Sourcewell cooperatives, and municipal RFPs.
Regional Hotspots
- Texas, Florida, Arizona: Indoor growth leaders — climate + population inflow + young families.
- California, New York, Illinois: Highest ticket prices, densest urban FEC concentration.
- Midwest & Mountain West: Outdoor capex up sharply due to federal park-modernization grants (Land & Water Conservation Fund reauthorization).

Risks & Headwinds
- Insurance premiums for trampoline/soft-play centers have risen 20–40% since 2021, compressing operator margins.
- Labor: staffing party attendants and safety monitors remains difficult in tight labor markets.
- Real-estate: 15,000–30,000 sq ft big-box vacancies (post-retail) are being absorbed by FECs, but rent renewals in prime suburbs are climbing.
- Municipal budget cycles create lumpy outdoor demand.
Outlook 2025–2027
Expect continued indoor consolidation via franchise rollups and PE platforms, more hybrid indoor/outdoor destination concepts (waterplay + adventure parks), and rising inclusive-play spend on the public side. Digital layers — RFID wristbands, app-based party booking, dynamic pricing — will separate top-quartile operators from the long tail.
Investment Takeaway
The U.S. playground market offers defensive family-spend exposure with clear consolidation upside on the indoor side and stable government-linked demand on the outdoor side. Highest-conviction opportunities: (1) multi-unit indoor operators in Sun Belt suburbs, (2) inclusive-play equipment manufacturers with Sourcewell/GSA contracts, and (3) tech-enabled operations platforms serving independent FECs.